Set Xtic and Ytic
To highlight the graph at a particular value of X axis, you'd use xtic. For example, the below code adds xtics at 3.5, 4.5, and 5.5.
# 2.gp
set output '2.png'
set terminal png truecolor # Set output type to png
set grid # Turn on grid in plot
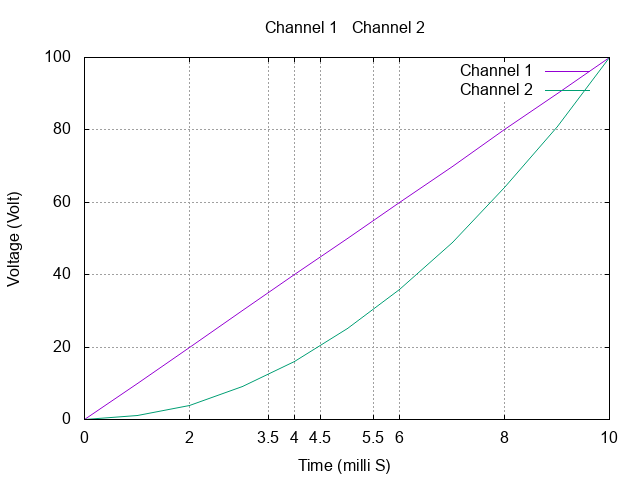
set title "Channel 1 & Channel 2"
set xlabel "Time (milli S)"
set ylabel "Voltage (Volt)"
# Enable when columns are separated by commas (CSV)
set datafile separator ","
set xtic add(3.5, 4.5, 5.5)
plot '2.csv' using 1:2 with lines title 'Channel 1', \
'2.csv' using 1:3 with lines title 'Channel 2'
You can also try using set xtic auto to automatically set xtics. ytic is the Y axis counterpart of xtic.