Set Xrange and Yrange
Suppose you'd like to limit the range for X axis in your plot. You can do it with set xr [Start:End]. For example, if you add the below line to the previous gnuplot file,
# 2.gp
set output '2.png'
set terminal png truecolor # Set output type to png
set grid # Turn on grid in plot
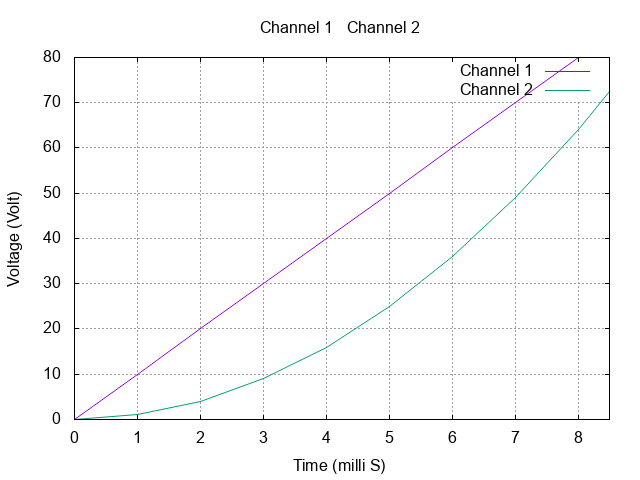
set title "Channel 1 & Channel 2"
set xlabel "Time (milli S)"
set ylabel "Voltage (Volt)"
# Enable when columns are separated by commas (CSV)
set datafile separator ","
set xr [0:8.5]
plot '2.csv' using 1:2 with lines title 'Channel 1', \
'2.csv' using 1:3 with lines title 'Channel 2'
The output will be limited from 0 to 8.5 in X. Similarly, you can use set yr [Start:End].