Your first plot
(With gnuplot ofcourse. Not your first ever plot.)
Step 1
Create a new folder plots on your Desktop, and open your terminal in that folder.
Ubuntu & MacOS
Fire up your Terminal. CD your terminal to the directory.
mkdir ~/Desktop/plots
cd $_
Step 2
- Create a new file
1.dat. Open it in Sublime text and enter the following data in it.
1 1
2 2
3 3
4 4
5 5
6 6
- Save 1.dat and create a new file called
1.gpand type the following code in it.
set output '1.png'

set terminal png truecolor

plot '1.dat'
- The first line sets the output file name.
- The second line set's the type of the output. You don't really need to fiddle with this.
- The third line specifies which data file to plot.
Step 3
Run it in your terminal. You should see an image named 1.png with the graph.
gnuplot 1.gp

Step 4
- Try replacing the last line in
1.gpwithplot '1.dat' with linesand run gnuplot again.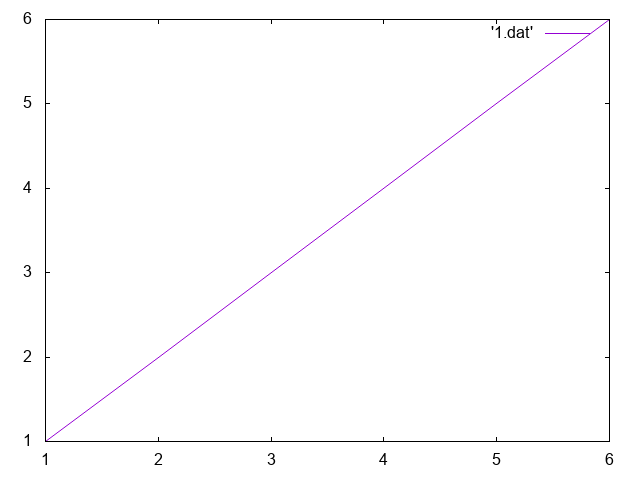
Step 5
- Nice! We got line plots working. Let's set the title for the line. Replace the last line with
plot '1.dat' with lines title 'Channel 1'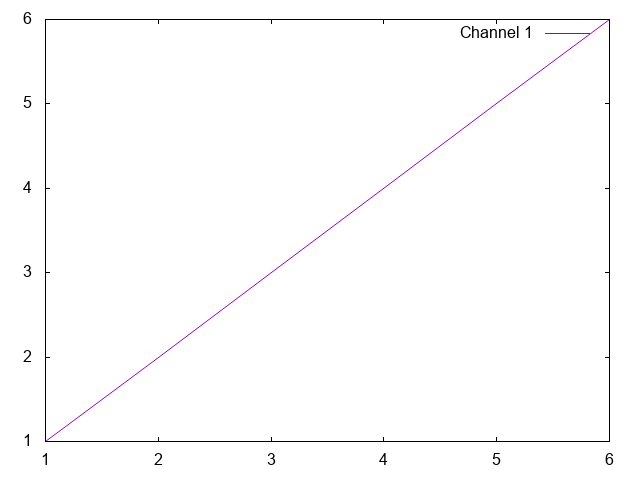
So far, your gnuplot file should look something like this.
set output '1.png'

set terminal png truecolor

plot '1.dat' with lines title 'Channel 1'